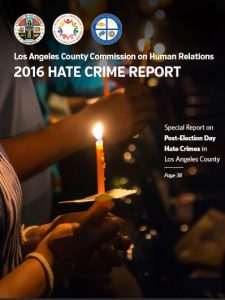
 LOS ANGELES — The Los Angeles County Commission on Human Relations (LACCHR) today released its annual account of hate crimes reported throughout Los Angeles County in 2016.
The report’s significant findings include the following:
- There were 482 hate crimes reported, only one less than 2015, which saw a 24% increase from the previous year and reached the highest total since 2011. By comparison, the California Attorney General’s office reported an 11.2 % statewide increase in hate crime in 2016.
- For the first time in many years, the largest targeted group for hate crime were gay men, lesbians and LGBT organizations, surpassing anti-African American hate crimes. The 118 homophobic hate crimes also had a high rate of violence (81%). These included one murder of a gay man shot to death by his father, who has since been convicted of the homicide and the hate crime.
- Hate crimes in which there was evidence of white supremacist ideology grew 67% from 63 to 105, constituting 22% of all hate crimes.
- Anti-African American crimes dropped by 19%, from 139 to 112, partly due to a drop in the number of hate crimes by Latino gang members targeting African Americans.
- During the post-2016 presidential election period (November 8 through December 31, 2016), hate crimes increased 9%, from 75 to 82. It’s important to note that the 75 crimes during the same period in 2015 represented a sharp 47% increase from the previous year, due to the rise in anti-Muslim/Middle Eastern hate crimes following the terrorist attacks in Paris and San Bernardino.
- Gender-based crimes spiked by 77%, from 22 to 39. Most of these were anti-transgender crimes which jumped from 18 to 31, a 72% increase. Latina transgender women were targeted the most.
- There were 101 religious hate crimes in 2016, with two-thirds targeting the Jewish community.
- After jumping 69% in 2015, anti-Latino crimes increased slightly in 2016, from 61 to 62. 77% of them were violent.
- Anti-white crimes jumped from 11 to 27, a 145% rise. Whites comprised 11% of racial hate crime victims, but are about 27% of the county population.
- Youth (under 18) continue to decline as suspects of hate crimes in LA County. From 2006 to 2016, youth have gone from the largest age group of hate crime suspects, to the smallest.
- In addition to those referenced above, county residents of diverse backgrounds were targeted for hate crime in 2016, including Armenians, Chinese, Asian/Pacific Islander, persons with mental disabilities, persons with physical disabilities, Scientologists, Afghans, Africans, Iranians, Iraqis, Japanese, and Koreans.
“At the Board of Supervisors, we are leading the effort to combat Islamophobia, homophobia, and hatred against immigrants – and we are best able to accomplish these goals by having concrete reporting and data,” said Los Angeles County Supervisor Hilda L. Solis. “Today’s troubling news reiterates the need to protect our residents of this County who deserve to live free of prejudice, discrimination, harassment, and violence. I will continue to make combatting hate crimes a priority for the County of Los Angeles.”
“We are extremely concerned that reported hate crimes remained at an elevated level in 2016,” said Robin Toma, LACCHR Executive Director. “And major cities across the country, including the city of Los Angeles, have already reported increases in hate crime during the first half of 2017.”
“The fact that white supremacist crimes grew 67% is alarming, particularly in the aftermath of the “Unite the Right” rally in Charlottesville. It seems that organized hate groups everywhere are feeling emboldened and increasingly visible,” said Commission President Isabelle Gunning.
Hate crimes occurred throughout Los Angeles County, but the largest number took place in the San Fernando Valley, followed by the Metro region that stretches from West Hollywood to Boyle Heights. The highest rate of hate crimes occurred in the Metro region, followed by the western part of the county that includes a number of affluent cities.
To view the complete report, including hate crime maps, graphs and tables, visit wdacs.lacounty.gov or www.lahumanrelations.org.


