America has become a far friendlier place for people who are lesbian, gay, bisexual or transgender. Since 2003, when Massachusetts became the first state to legalize same-sex marriage, another 35 states and the District of Columbia have done the same.
This shift in attitudes toward LGBT rights is also reflected in a national poll conducted in May by Gallup, which found a record-high 60% of Americans support same-sex marriage, up 5% from last year.
As the legal tide has turned, metropolitan areas have become more accepting of people who identify as LGBT. Still, some cities are more progressive than others, and 14 states still have constitutional bans on same-sex marriage.
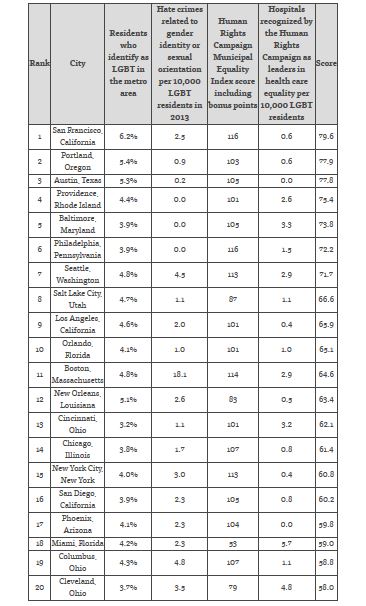
In honor of Pride Month, NerdWallet crunched the numbers to find the most LGBT-friendly cities in the U.S. with San Diego coming in at No. 16.
NerdWallet included the following factors in its analysis:
- The percentage of the population identifying as LGBT in each metro area
- LGBT-related hate crimes per 10,000 residents who identify as lesbian, gay, bisexual and transgender
- The Human Rights Campaign’s Municipal Equality Index
- The Human Rights Campaign’s number of leaders in LGBT health care equality
Top 20 LGBT-friendly U.S. cities
Methodology
The overall score for each city was calculated based on the following metrics:
- The percent of residents within the city’s metro area identifying as lesbian, gay, bisexual or transgender. The data came from Gallup and was based on a survey of America’s 50 largest metro areas from 2012 to 2014. This was 30% of a city’s total score.
- The number of hate crimes motivated by sexual orientation or gender identity in a city in 2013 per 10,000 LGBT residents. The information comes from the FBI Hate Crime Statistics, which relies on police departments to report local data. This was 20% of a city’s total score.
- The Human Rights Campaign’s 2014 Municipal Equality Index score. This was 35% of a city’s total score.
- The number of hospitals recognized by the Human Rights Campaign as leaders in LGBT health care equality in the city per 10,000 LGBT residents. This was 15% of a city’s total score.
This is the third year NerdWallet conducted a study on the data about LGBT residents in cities across the U.S. Here are links to our previous studies from 2013 and 2014.


